Planetary Atmospheres
Io's thin atmosphere changes by a factor of 27
Nineteen years of infrared spectra map a persistent dayside asymmetry that eclipse cooling cannot explain on its own.
Briefed October 9, 2026 · Aliens in the Clouds
Accepted Study · Long-Term Atmospheric Map
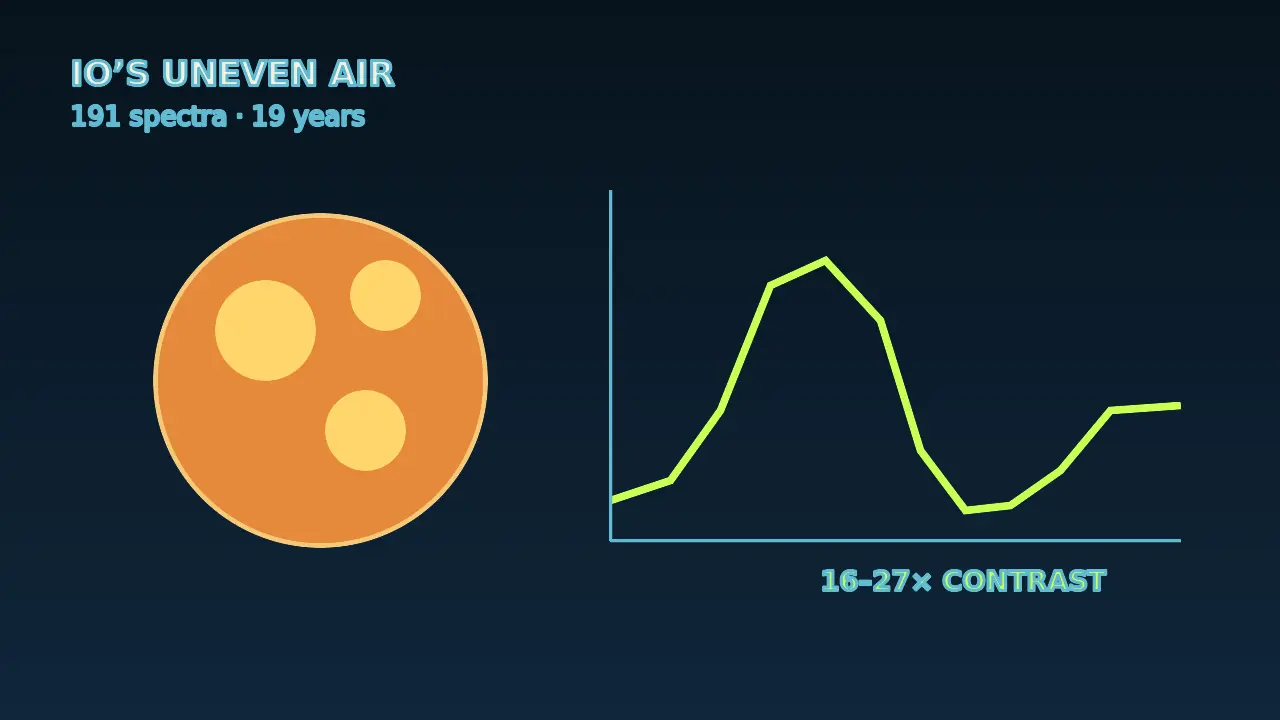
Rohini Giles and colleagues assembled 191 high-resolution mid-infrared observations of Io taken since 2001 with the TEXES spectrograph at NASA's Infrared Telescope Facility. Sulfur-dioxide absorption lines provide equatorial column densities across the full range of central longitudes, while a seasonal model normalizes the long time span.
Both perihelion and aphelion maps peak near 200 degrees west and reach their minima near 305 degrees west, with maximum-to-minimum contrasts of about 16 and 27 respectively. The atmosphere falls off more sharply across the trailing hemisphere. Eclipse-driven cooling contributes to the pattern but cannot reproduce its full shape; uneven sulfur-dioxide frost is also likely important, while volcanic activity remains part of the comparison.
Why it matters
Io offers a natural laboratory where sunlight, surface frost, eclipses, and volcanism build and collapse an atmosphere on observable timescales.
What the source establishes
Accepted in The Planetary Science Journal and submitted to arXiv October 8. The longitudinal asymmetry is derived from 191 spectra; assigning relative roles to frost, eclipses, and volcanism requires modeling.
Published by Aliens in the Clouds. These AI-assisted summaries link to their sources and distinguish reported claims from established findings. Skinny Ed is a fictional mascot; High Thoughts are comedy. Send a correction with its source.